Picture provided by SolarFitUK.com
Results at Different Orientations
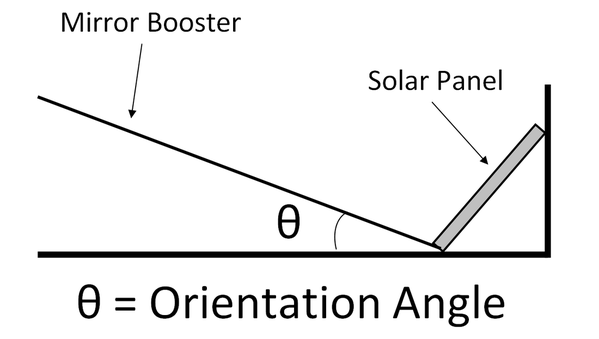
The orientation angle presented in the graphs below is defined as the angle between the mirror booster and the ground as shown.
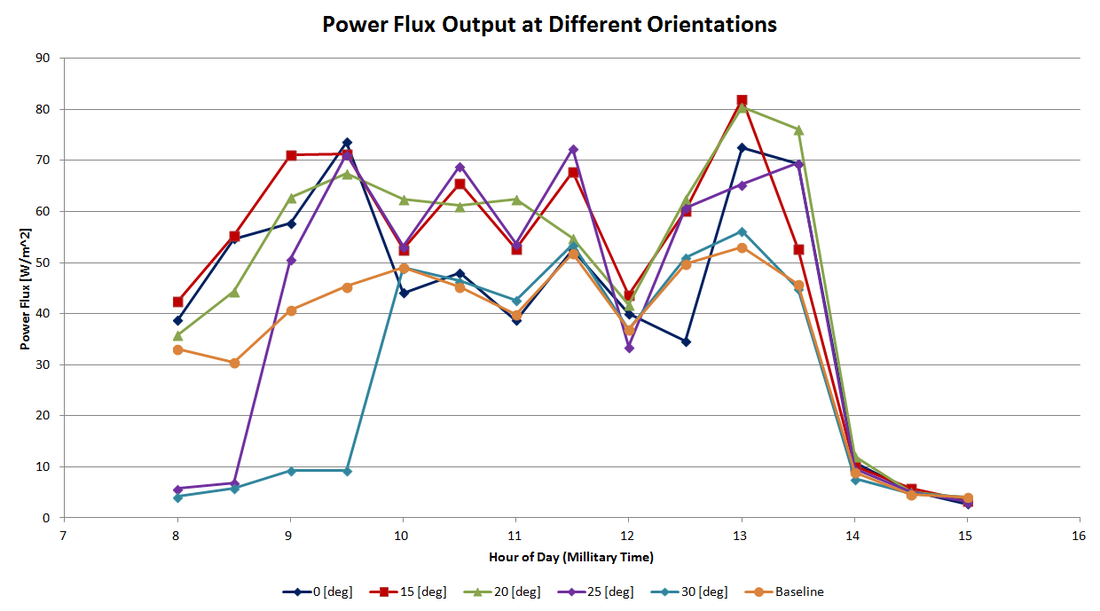
The figure above shows the power flux output of the solar panel throughout the course of a day at different mirror booster angles. Note that the power flux is the power output of the panel divided by the surface area of the cells, and this can be directly compared to solar panels of different sizes. The baseline measurements (in orange) are averaged values of power flux output without the mirror booster attached and will be used to rate the effectiveness of the mirror booster.
Upon initial examination of the graph, it can be seen that the mirror booster as a whole served to increase the power flux of the solar panel. This particularly occurred during the hours of 9:00 AM to 1:30 PM (0900-1350 military time). Since these hours are the optimum solar collection period for any solar panel, this large power flux increase is a particularly good result. The data also shows that around 2:00 PM (1400 MT) the solar power flux falls off for all panels. This is to be expected with solar collection because in the winter months the sun is getting low by this time of day. Obstructions such as trees and buildings can block the setting sun's path to the solar panel surface and the sun itself will have a lower light intensity than at midday.
An additional interesting result of the data reduction shows that higher angled orientations had a much lower power flux in the morning than the corresponding baseline value. At this time of day, the sun was at a low angle causing the mirror booster to cast a shadow over most of the solar panel's interface. This naturally caused a much lower power flux output.
A natural question that arises is whether mirror booster orientation plays a significant role in power flux output. Due to the data presented in the figure as well as the discussion above, it can be seen that trade offs exist with each angle of orientation. For instance, at an orientation angle of 25 degrees a large amount of power flux is lost during the morning hours, but during the midday hours the largest observed power flux comes with this orientation. The complicated nature of this analysis makes sense because the effect of the mirror booster is threefold in nature. It could cast a shadow over the solar panel and lose power flux, it could reflect sunlight onto the collector and increase power flux, or it could reflect sunlight over the solar panel and essentially cause no change to the solar power flux output. The effect of the mirror booster at different orientations depends on the orientation of the sun throughout the day, therefore the effectiveness of the mirror booster is a function of sun orientation. To investigate this complicated phenomenon, an analysis based on the percent increase (normalized by the baseline values) of the solar power flux will be conducted. This will in a sense normalize the data based on the baseline measurements and give a clearer effect of each orientation. This analysis will be presented below.
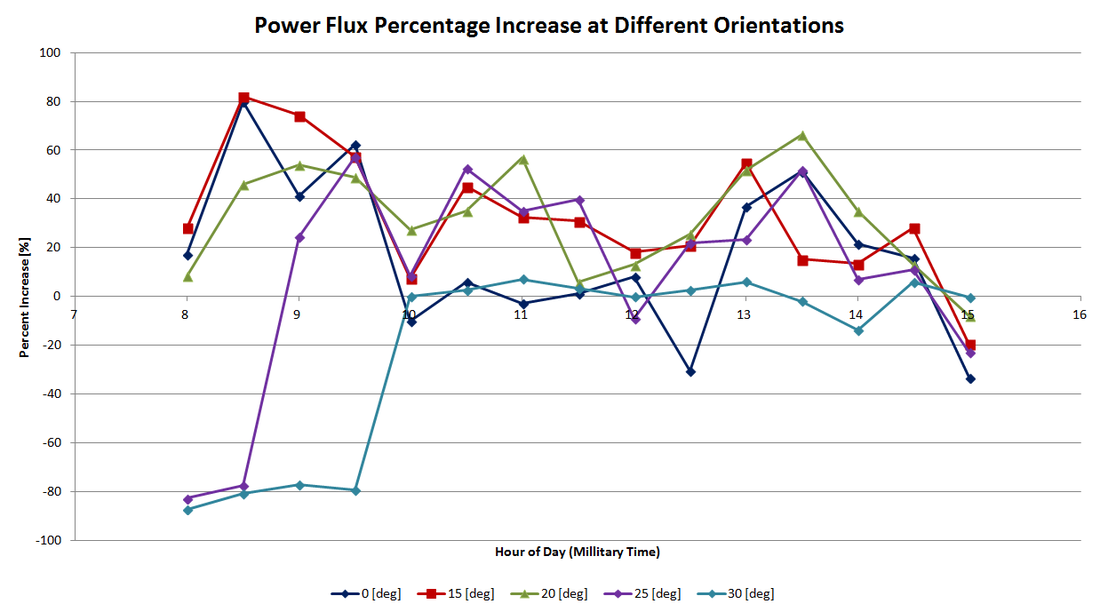
The above graph depicts the power flux output percent increase normalized by the baseline measurements. This data makes it easier to visualize the improvements caused by the mirror booster. It can be seen that on average the largest percent increases come during the early afternoon and late afternoon hours. During the midday hours there is still a significant percent increase in power flux, but this is less than during the early/late afternoon.
These observations are consistent with the analysis presented above. The advantage of normalizing this data is that it gives a clearer representation of which mirror booster orientations are most favorable and their respective trade-offs. As can be seen, the 0 [degree] (flat) and 30 [degree] orientations clearly do not provide enough of a percentage increase to be competitive with the other orientations. In fact, the 30 [degree] orientation blocked sunlight to the collector during the morning hours and had a negligible improvement during the rest of the day. It can be argued that this orientation actually made the solar panel worse than it was without a mirror booster.
The 15 [degree], 20 [degree], and 25 [degree] mirror booster orientations all had competitive attributes throughout the day. The 15 [degree] orientation had a much higher percent increase during the morning hours and was slightly less than the others during the midday hours. The 20 [degree] orientation had a much lower output than the others during the morning hours but was the highest at noon and during late afternoon. The 25 [degree] orientation consistently falls in between the other two except during the early morning when the mirror booster casts a shadow over the panel. Since this caused a substantial energy loss it can be assumed that this is not one of the best orientations.
The best performing orientations are between 15 [degree] and 20 [degree]. Both have their potential advantages and setbacks. The 15 [degree] collects more energy during the early morning through early afternoon hours and the 20 [degree] collects more energy during the late afternoon and at midday. Therefore, the decision on which orientation is best depends on the external conditions to where the solar panel is placed. In terms of where this panel was being tested the 15 [degree] panel would probably be the best orientation because it consistently had a higher power flux than the 20 [degree] orientation. The opposite may be true in other locations however and should be examined in individual cases.
The Big Picture
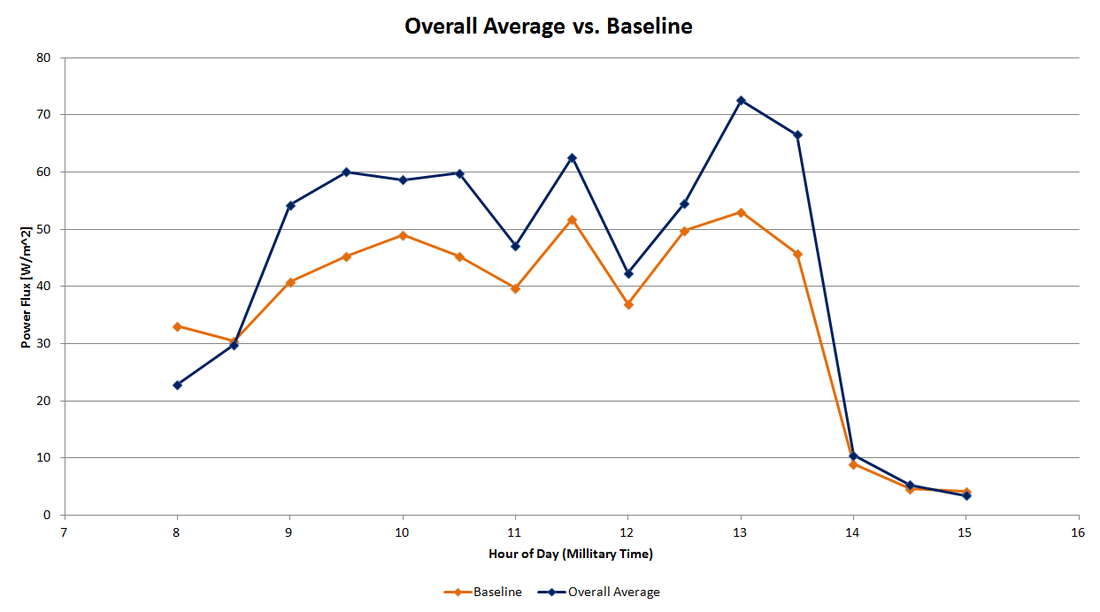
The figure above shows the overall mirror booster power flux output verses the baseline values. The overall average was taken across all mirror booster orientations tested. This figure is useful to show the overall change that a mirror booster can make to the solar panel. As can be seen except for the early morning hours, the mirror booster caused a substantial increase in the power flux output of the solar panel. This increase was largest during the early and late afternoon when the sun's angle to the mirror booster was at an optimum value. During midday this increase was not as large but was still a noticeable improvement. It is important to note that the average power flux is an accumulation of all angles tested and not necessarily the best orientations. Although the increased power flux is a function of mirror orientation, it is safe to conclude that there is a large overall improvement in the power gained from use of this technology.
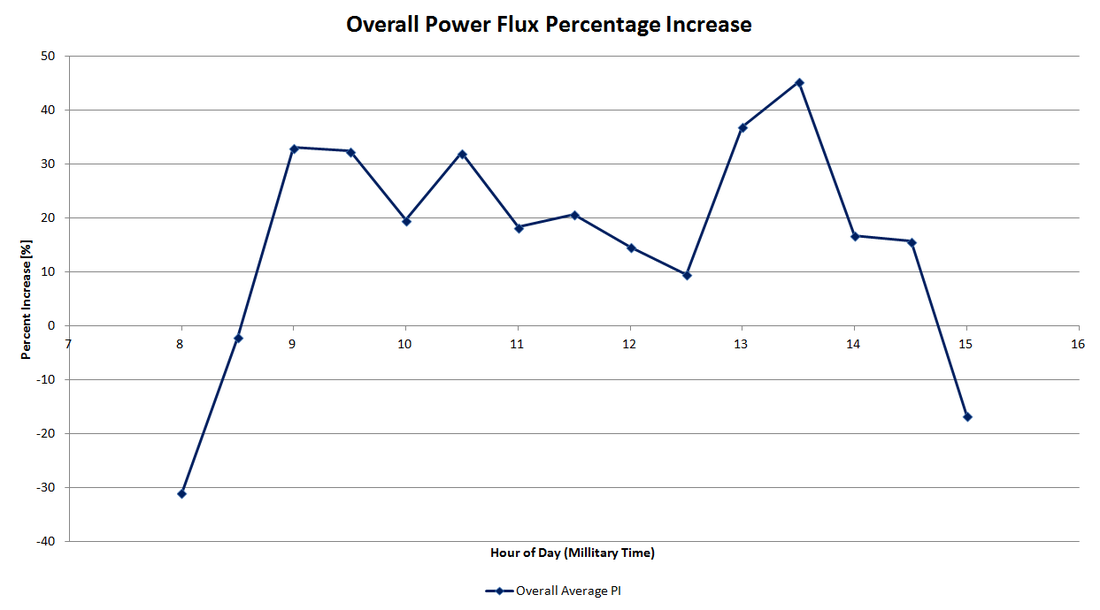
The above graph shows the percent increase of the overall power flux measurements normalized by the baseline values. As shown, during most of the day, the mirror booster caused a percent increase in power flux in the range of 20% - 30%, reaching a high of 45%. These improvements were larger than what was expected and show an optimistic future for this technology. It can therefore be concluded that a mirror booster will improve a solar panels output by around 20%-30% as long as a good orientation is chosen.
